Cartogram creation
A cartogram is a variable scale map that preserves topological relations.
Cartograms can be used to visualize statistical data.
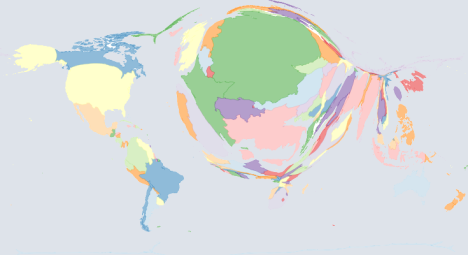
Example cartogram
The following example visualizes the distribution of epanet.de visitors:
Software to create cartograms
The ScapeToad software can be used to create cartograms.
It uses the diffusion-based Gastner/Newman algorithm.
ScapeToad is free software (open source) released under the terms of the GPL.
Other languages
This page is also available in: Deutsch.